What are all these "curves" in the "Points" form about?
In this release, in addition to the existing start and end values, the user can change the way that Agony calculates the variables at each step. This is done by allowing the user to draw a large number of curves, each of which affect a different variable.
The "y" co-ordinate at each point along these curves determines by how much its associated variable is to be affected. (Other functions, options for how the curve affects its variable will be forthcoming when I have decided what they will be).
The start point of a curve affects the first step of Agony, and the end point of a curve affects the last step of Agony. The point halfway along the curve affects the step halfway through Agony.
These curves can be edited in Agony, by dragging their controlling points around.
This tutorial will demonstrate a simple example.
-
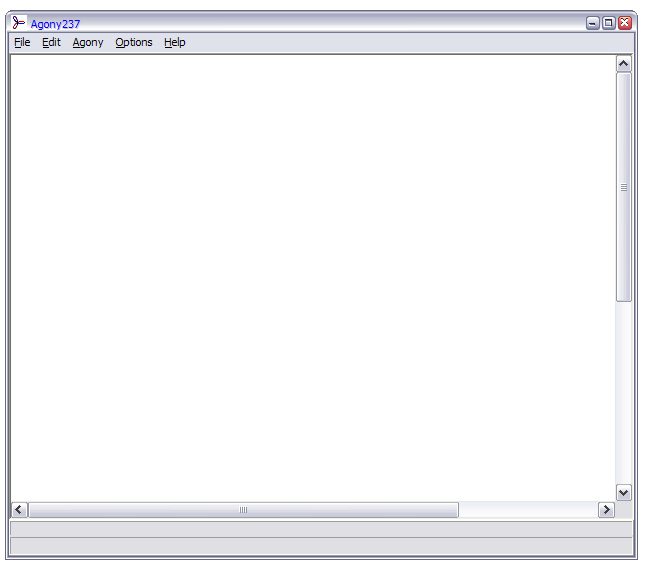
Start Agony (this tutorial assumes that Agony has no configuration file to begin with), you should be presented with a window like this:
-
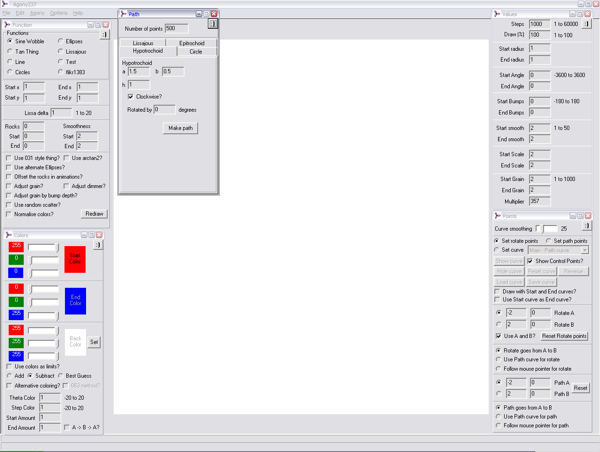
Maximise Agony, and display the main 5 option windows, using the F1, F2, F3, F4 and F5 keys. Position these so that they are accessible and usable., like so:
-
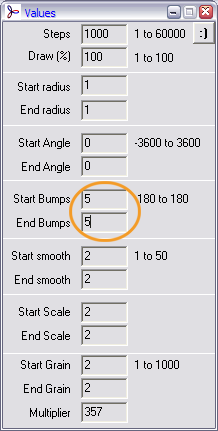
In the "Values" form, set the "start" and "end" bumps values to 5. In this tutorial, the basic shape we are drawing with is a circle, and the bumps values determine how many "bumpy" deformations there are around its circumference, in this case 5.
-
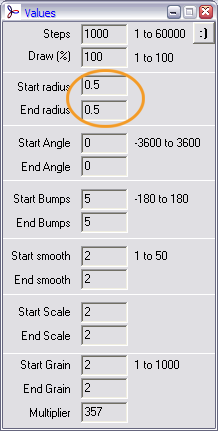
Again, in the "Values" form set the "start" and "end" radius values to 0.5. This ensures that the standard Agony behaviour will be for there to be no difference in the radius of our deformed circle across the different steps of our Agony drawing.
-
Press the 'd' key on your keyboard to start Agony drawing.
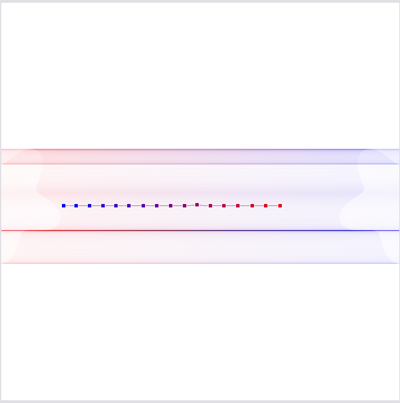
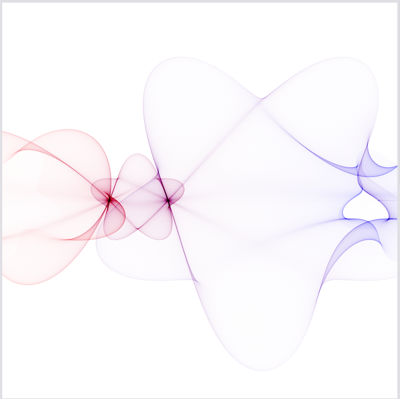
Press the 'e' key to toggle drawing each step. Not drawing every step is significantly faster than doing so. Agony should produce a picture resembling this (but extending across the whole canvas):

-
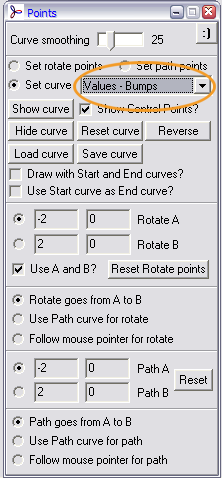
In the "Points" form, select the "Set curve" option as shown
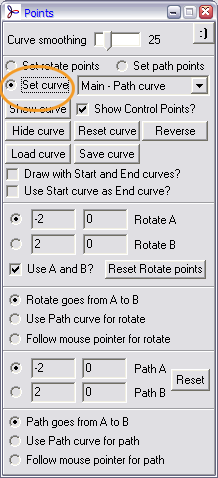
-
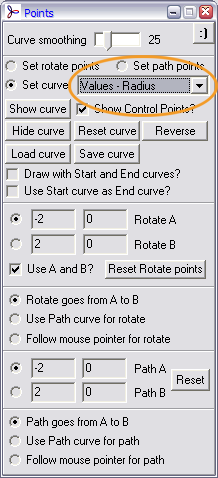
In the "Points" form, from the dropdown list of "curves", select the one named "Values - Radius". These curves are named according to the Agony setting they affect, the name indicates on which form you can find this setting.
In this tutorial, we shall be affecting the "radius" setting, which we set to be 0.5 in step 4, above.
While the "Values - Radius" option from the dropdown is selected, any curves or "paths" we generate, manually or from the "Paths" form, are stored in Agony to affect the Radius. Agony can store many such curves all affecting different aspects and settings.
-
Having specified which curve we are working on, "Values - Radius", in the step above, now draw a line across the canvas. This is done by positioning the mouse pointer at the place you want to start drawing from, then pressing the Right Mouse button, and then moving the mouse across the canvas until you are done. Then release the Right Mouse button. As you are drawing, you should see some dots being drawn showing where your line is.

-
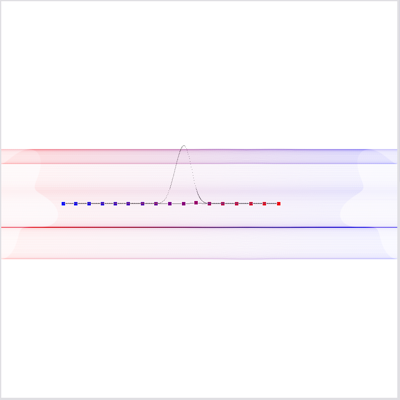
When you release the mouse button, Agony will redraw the line you drew out, with "control points" along its length. This line across the screen will now be used to affect the radius in Agony.
-
Press the "c" key. This will clear the curve from the screen. It will still be stored in memory though.
Press the "c" key again, this will clear the picture we drew with Agony earlier.
Press the 'd' key on your keyboard to start Agony drawing.
Press the 'e' key to toggle drawing each step. Not drawing every step is significantly faster than doing so.
You should see an image like this being drawn - not very exciting, because our "Values - Radius" curve is just a straight line across the middle of the screen. Remember that the "y" co-ordinate (vertical position on the canvas at each point) of this curve is used to affect the radius. A straight horizontal line has no variation in the "y" direction, so our Agony image should have no variance in radius along its length.

-
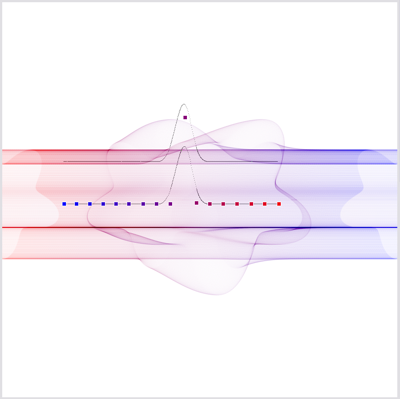
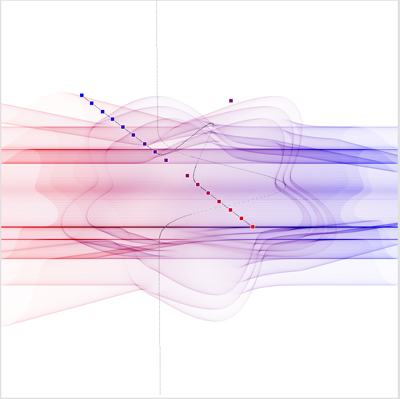
Once our image has been drawn, press the "s" key. This will display our "Values - Radius" curve again. Agony allows us to edit this curve to our liking.
-
When the curve is displayed, we can move our mouse pointer over the control points. When the mouse is over a control point, the mouse pointer should turn into a hand.
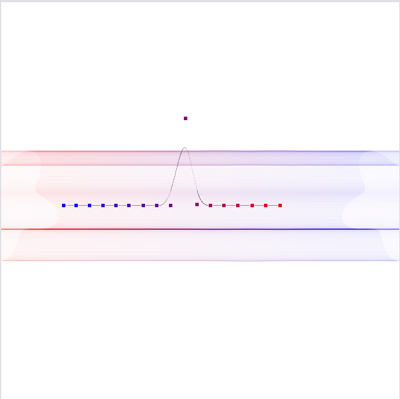
Move your mouse pointer over a control point near the middle of the "Values - Radius" curve, and click on it with the Left mouse button. While keeping the left mouse button depressed, drag the control point up the screen.
A preview of the curve, defined by the new position of the control point you are dragging, is drawn as you move this around. When you are happy with the new curve, release the left mouse button.
-
When the left mouse button is released, Agony will redraw the "Values - Radius" curve incorporating the new position of the control point.
-
Press the 'd' key on your keyboard to start Agony drawing.
Press the 'e' key to toggle drawing each step. Not drawing every step is significantly faster than doing so.
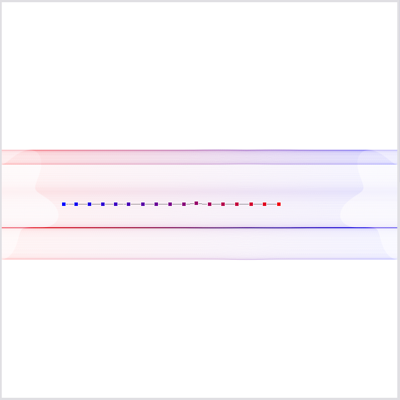
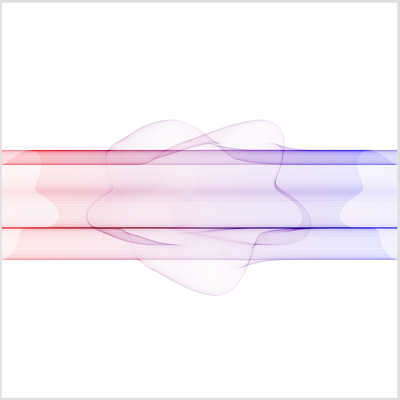
You will see that the radius of our 5 pointed circle has been affected by our "Values - Radius" curve.
-
Once our image has been drawn, press the "s" key. This will display our "Values - Radius" curve again. Agony allows us to edit this curve to our liking.
-
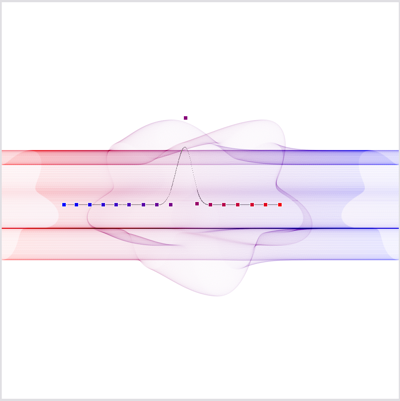
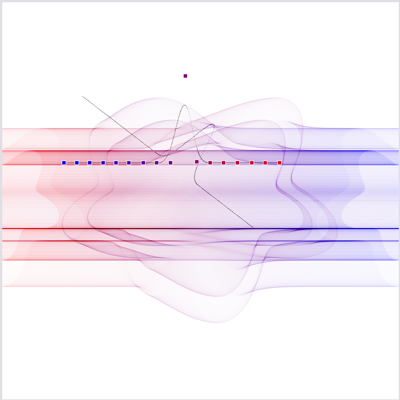
Move your mouse pointer over a control point near the middle of the "Values - Radius" curve, and, while holding the SHIFT key, click on it with the Left mouse button. While keeping the left mouse button depressed, drag the control point up the screen.
In this mode, the entire "Values - Radius" curve is shifted according to your mouse movements.
A preview of the curve, defined by the new position of the control point you are dragging, is drawn as you move this around. When you are happy with the new curve, release the left mouse button.
-
Press the 'd' key on your keyboard to start Agony drawing.
Press the 'e' key to toggle drawing each step. Not drawing every step is significantly faster than doing so.
You will see that the radius of our 5 pointed circle has been affected by our "Values - Radius" curve and its new position.
Once our image has been drawn, press the "s" key. This will display our "Values - Radius" curve again. Agony allows us to edit this curve to our liking.
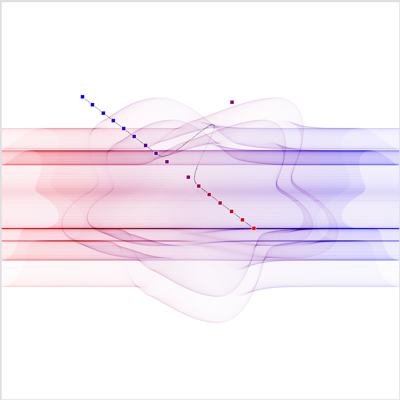
Move your mouse pointer over a control point near the middle of the "Values - Radius" curve, and, while holding the CTRL key, click on it with the Left mouse button. While keeping the left mouse button depressed, drag the control point up the screen.
In this mode, the entire "Values - Radius" curve is rotated according to your mouse movements.
A preview of the rotated curve, defined by the new position of the control point you are dragging, is drawn as you move this around. When you are happy with the new curve, release the left mouse button.
If you release the mouse button, but are not happy with the position of the curve, you can undo your last amendment by pressing CTRL-Z on your keyboard. Agony remembers one level of undo for each of its many user defined curves.
-
When the left mouse button is released, Agony will redraw the "Values - Radius" curve rotated into its new position.
-
Press the 'd' key on your keyboard to start Agony drawing.
Press the 'e' key to toggle drawing each step. Not drawing every step is significantly faster than doing so.
You will see that the radius of our 5 pointed circle has been affected by our "Values - Radius" curve and its newly rotated position.
In this case the radius starts bigger at the beginning and decreases as Agony draws out the picture.
-
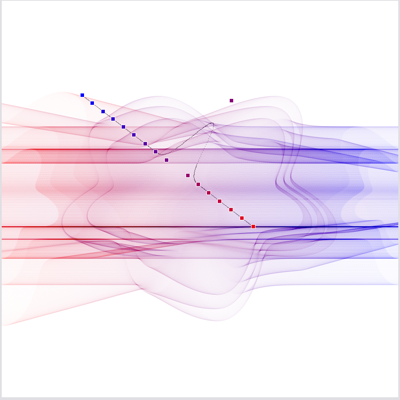
If you want to exaggerate the amount by which the "Values - Radius" curve affects the radius, we are able to resize the entire curve.
Move your mouse pointer over a control point near the middle of the "Values - Radius" curve, and, while holding the ALT key, click on it with the Left mouse button. While keeping the left mouse button depressed, drag the control point up the screen.
In this mode, the entire "Values - Radius" curve is rotated and grown/shrunk according to your mouse movements.
A preview of the rotated curve, defined by the new position of the control point you are dragging, is drawn as you move this around. When you are happy with the new curve, release the left mouse button.
-
When the left mouse button is released, Agony will redraw the "Values - Radius" curve rotated and expanded into its new position.
-
Press the "c" key. This will clear the curve from the screen. It will still be stored in memory though.
Press the "c" key again, this will clear the picture we drew with Agony earlier.
Press the 'd' key on your keyboard to start Agony drawing.
Press the 'e' key to toggle drawing each step. Not drawing every step is significantly faster than doing so.
You will see that the radius of our 5 pointed circle has been affected by the "y" co-ordinate along the length of the "Values - Radius" curve in its new size and position.
-
Next, we can try something a little more interesting.
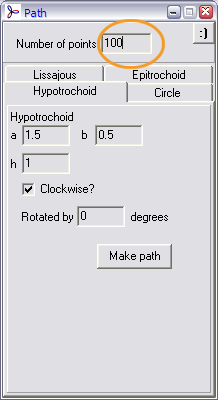
Press the "c" key to clear the canvas, and select the "Path" form.
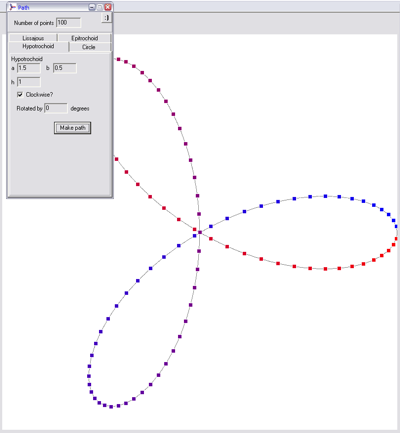
Set the "number of points" to 100, as shown (this number is the number of control points that Agony will calculate).
-
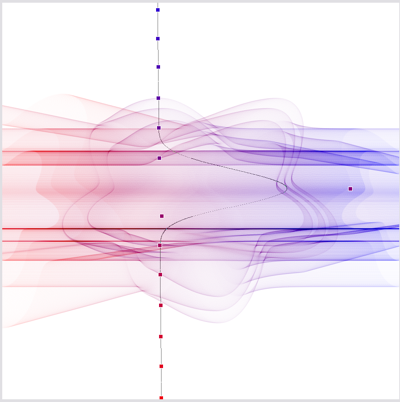
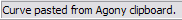
Click "Make path" on the "Path" form. This should result in a pretty curve, much like the Agony icon being drawn. This curve is now the "Values - Radius" curve. (Remember at this moment we can still get our old curve back by using CTRL-Z. In fact we can go between this new curve and the old one and back again by pressing CTRL-Z over and over.)
The radius of our 5 pointed circle will now be changed according to the y-coordinates along this new curve.
-
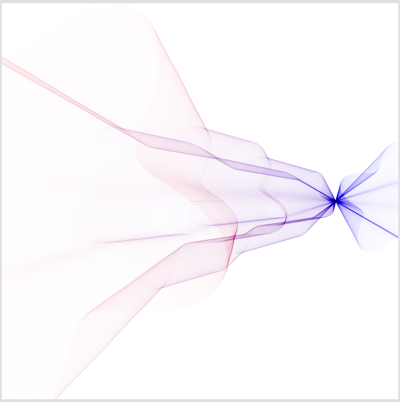
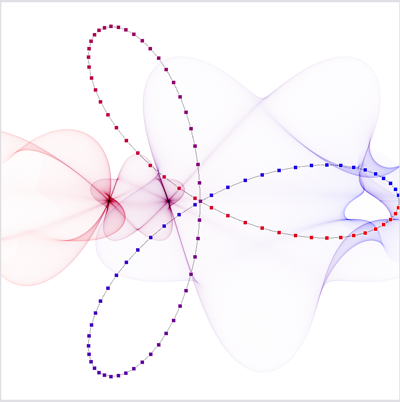
Press the 'd' key on your keyboard to start Agony drawing.
Press the 'e' key to toggle drawing each step. Not drawing every step is significantly faster than doing so.
You will see that the radius of our 5 pointed circle has been affected by our new, Agony generated hypotrochoid!

If you get lost with the curves, and want to reset them all, press CTRL-K, this resets all the curves.
Next we will use the "Values - Bumps" curve to affect the number of bumps around the circle we have.
-
Press the "s" key. This will display our "Values - Radius" curve again. Agony allows us to copy this curve to an "Agony clipboard" for reuse in a different curve.
-
Press CTRL-C to copy this curve into the Agony clipboard.
You should see this message, "Curve copied to Agony clipboard", in the status bar.
-
In the "Points" form, from the dropdown list of "curves", select the one named "Values - Bumps". These curves are named according to the Agony setting they affect, the name indicates on which form you can find this setting.
One thing to notice, at this time, is that in the drop down list of curves, any curve which is currently defined has a ">>" in front of its name in the list. At this time, only the "Values - Radius" item will have this.
-
Having selected the "Values - Bumps" curve, and that curve not currently being defined, Agony will just be displaying the image we created earlier.
-
You can now paste the curve we copied from "Values - Radius" into the currently selected curve, "Values - Bumps". You do this by pressing CTRL-V. Upon pasting this curve in, Agony will display the message "Curve pasted from Agony clipboard" in the status bar
Agony will also draw the new curve onto the screen. This curve displayed now is the "Values - Bumps" curve, distinct from the "Values - Radius" curve, and any manipulation or editing of the "Values - Bumps" curve will not affect the "Values - Radius" curve.
-
Press the "c" key. This will clear the curve from the screen. It will still be stored in memory though.
Press the "c" key again, this will clear the picture we drew with Agony earlier.
Press the 'd' key on your keyboard to start Agony drawing.
Press the 'e' key to toggle drawing each step. Not drawing every step is significantly faster than doing so.
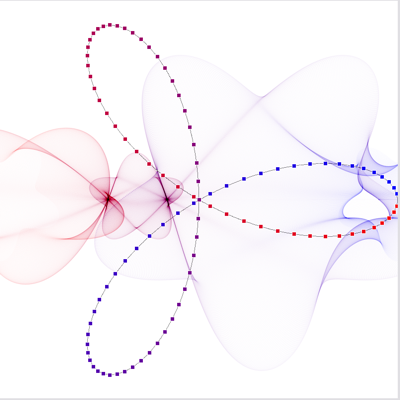
You will see that both the radius of and the number of bumps around our 5 pointed circle have been affected by "Values - Radius" and "Values - Bumps" curves!
The rest is up to you... good luck.
Agony Tutorial 001
Agony Tutorial 002
Agony Tutorial 003
Agony Tutorial 004
Agony Tutorial 005
Agony Tutorial 006
Agony Tutorial 007
Agony Tutorial 008
Agony Tutorial 009
Some user comments about the tutorials
"These were very helpful!!! Thanks a million!"
"I enjoy working with Agony very much and tutorials were very helpful"
"I have to express my joy in finding your agony program! I am having the best time using it (first blindly and then with your tutorials) ."
"It's very very helpful, thanks! "
"Its good to know that you made the tutorials. A few days back, I was trying to work on one of your program and it just didn't work!"
The end.